
If you have set up an active plot before running a trajectory calculation, COPASI will automatically display the plot. The plot window consists of three main components:
Toolbar: Located at the top, the toolbar allows you to print the plot, save the data to a file, adjust axis scaling, or deactivate the plot so it does not launch automatically when running the task.
Legend: The legend is interactive. You can toggle the visibility of individual curves by clicking on their corresponding entries.
Plot Area: This displays the actual graphical representation of your data.
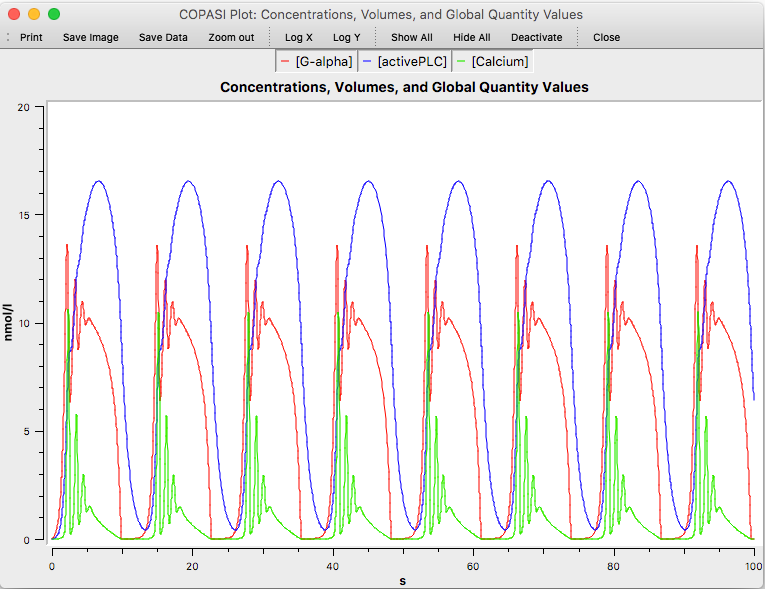 |
| Plot Window |
When you move the mouse cursor inside a plot widget, its coordinates, relative to the plot’s coordinate system, are displayed next to the cursor.
To zoom in on a specific area of the plot, click and drag to select a rectangular region. The plot will automatically zoom in to focus on the selected area. To return to the original view, right-click within the plot area.