If you have defined an active plot before calculating a trajectory, COPASI will draw the plot. The plot window has
three elements. A tool bar at the top, that lets you print the plot or save the data into a file, change the axis scaling,
or even to deactivate the plot, so it will not automatically start when the task is run; the legend, which
is interactive such that the drawing of certain curves can be toggled by clicking on the corresponding legend entry;
and the actual plot.
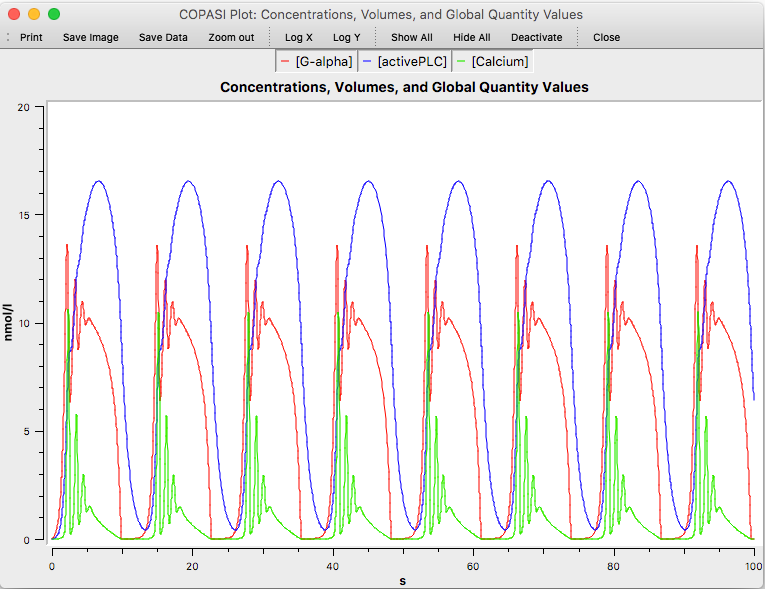 |
| Plot Window |
During moving the mouse cursor inside a plot widget, the mouse coordinates with respect to the coordinate system of
the plot are displayed beside the mouse cursor.
In order to zoom further into a plot, you can select a rectangular area on the plot by clicking somewhere in the
plot and dragging the pointer. The plot will now zoom into the area you just selected. To go back to the original
plot, right click on the plot area.
Warning: Macintosh users with single button mice should
use CTRL-click.